Monitoring network traffic or bandwitdh usage is a must in a SysAdmin tasks. There are many differents tools to manage this monitoring, but one of my favorites is vnStat. The main advantage of this tool is the simplicity of its usage.
Installation
With Ubuntu, the way to install this tool is with apt.
sudo apt install vnstat
First steps
Once installed, it is important to know which interfaces are going to be monitoried. For this, you can use next command
netstat -i
In my case, I have 2 interfaces (eth0, wlan0). The lo interface is the loopback interface, and this is not monitored.
yvoictra|zoar:~$ netstat -i
Kernel Interface table
Iface      MTU    RX-OK RX-ERR RX-DRP RX-OVR    TX-OK TX-ERR TX-DRP TX-OVR Flg
eth0      1500   109181      0      6 0         10643      0      0      0 BMRU
lo       65536      309      0      0 0           309      0      0      0 LRU
wlan0     1500     1334      0      1 0            33      0      0      0 BMRU
Then, you can check if the databases have been created. There is a daemon running updating the database each 5 minutes.
yvoictra|zoar:~$ ls -ltr /var/lib/vnstat/
total 8
-rw-r--r-- 1 vnstat vnstat 2784 Apr 3 18:35 wlan0
-rw-r--r-- 1 vnstat vnstat 2784 Apr 3 18:35 eth0
How to use it
You can force an update with this command
vnstat -u
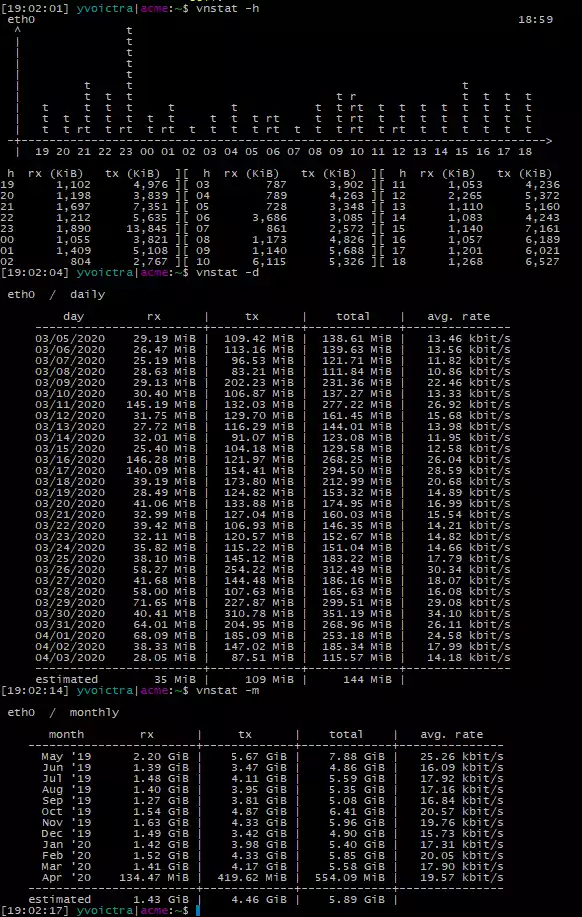
And to see the statistics there are many options, here some of theme:
d:Daily statistics for the last 30 days.m:Monthly statistics for the past 12 months.w:Statistics for the last 7 days, and the current and previous week.h:Hourly statistics for the last 24 hours.t:Top 10 days with the highest traffic.
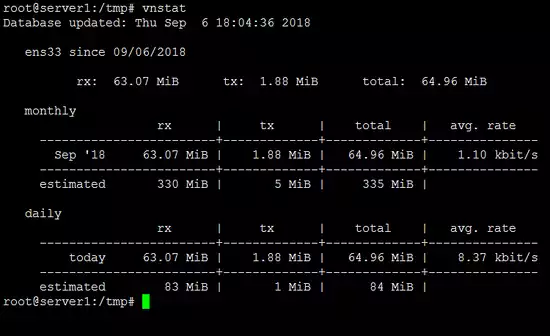
Here and example of the output
Conclusion
vnStat is a powerful tool with multiple options to control the traffic managed by a machine. From my point of view, it should be installed in each machine connected to the Internet.