
Grafana is an open source metric analytics & visualization tool which can help us to monitor the system with a nice Dashboard.
Installing Grafana
Grafana is available in the APT packages repository, however it could not be the latest version, so we’ll use the official Grafana repository.
First, it is needed to install the software needed before install Grafana.
sudo apt install -y apt-transport-https
sudo apt install -y software-properties-common wget
Next step is to download the GPG Key, in order to install signed packages:
sudo wget -q -O /usr/share/keyrings/grafana.key https://apt.grafana.com/gpg.key
Now it is needed to create the file /etc/apt/sources.list.d/grafana.list to add the repositories of Grafana.
This one is for stable releases:
echo "deb [signed-by=/usr/share/keyrings/grafana.key] https://apt.grafana.com stable main" | sudo tee -a /etc/apt/sources.list.d/grafana.list
And this one for beta releases:
echo "deb [signed-by=/usr/share/keyrings/grafana.key] https://apt.grafana.com beta main" | sudo tee -a /etc/apt/sources.list.d/grafana.list
Refresh your APT cache to update your package lists.
sudo apt update
Then make sure Grafana will be installed from the official repository.
apt-cache policy grafana
Now, we can proceed with the installation of Grafana.
sudo apt install grafana
Once installed, now we can start it.
sudo systemctl start grafana-server
We should check now Grafana has started OK (active (running)).
sudo systemctl status grafana-server
And finally, enable Grafana to start at boot time.
sudo systemctl enable grafana-server.service
Installing Prometheus
Prometheus is an open-source systems monitoring and alerting toolkit. We are going to use the APT tool to install it:
sudo apt install prometheus prometheus-node-exporter
After this, we should check we have 2 new TCP connections listen on port 9090 and 9100.
netstat -plunt
Also, we could see that on port 3000 it is listening Grafana.
Check version of the installed prometheus-node-exporter package
It’s important to know the version of the prometheus-node-exporter package because the Grafana Dashboards needs to be compatible.
To do it just execute this command.
prometheus-node-exporter --version
In my case, I have this version:
node_exporter, version 1.3.1 (branch: debian/sid, revision: 1.3.1-1)
Login into the system
Once installed Grafana & Prometheus, you can access Grafana site from a Web Browser. The URL is the IP address of the web server (or the domain), and the port is the 3000. The first page you should see is this.
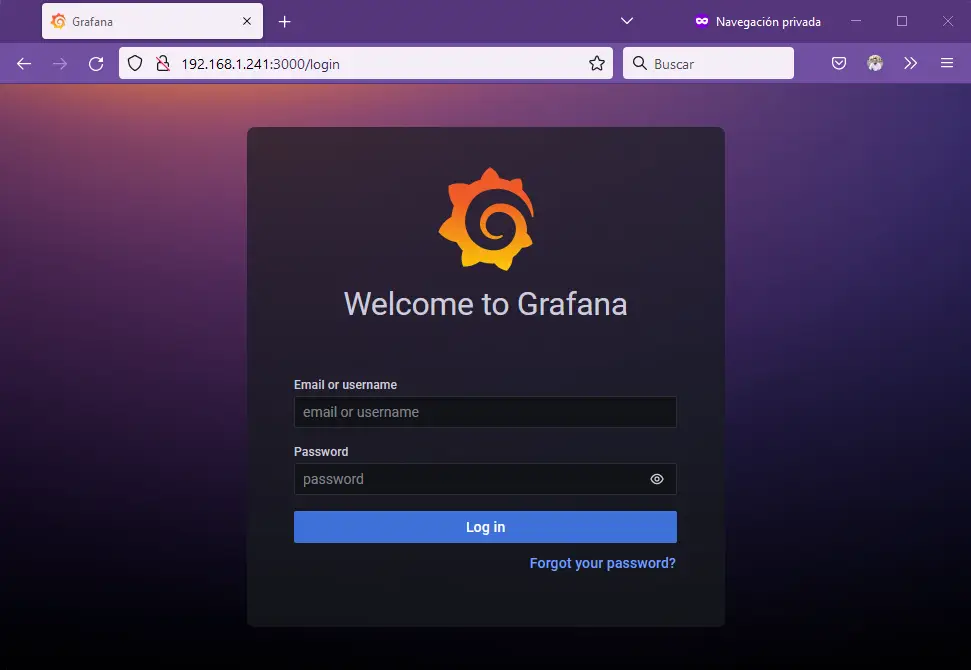
You can login with the admin/admin credentials. Once logged, you have to change the password of the admin account.
Setting up the Prometheus Data Source
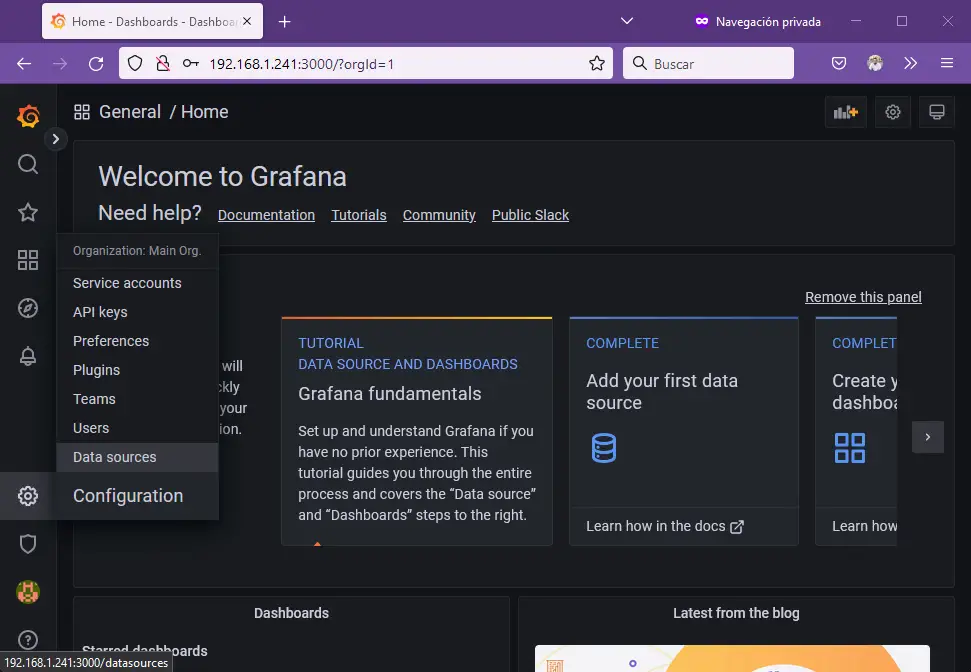
Grafana needs to add new Data Sources, which is the database in which are stored the measures later Grafana will show.
Once in the menu of the new datas ources, it is needed to add the URL http://localhost:9090 for our Prometheus.
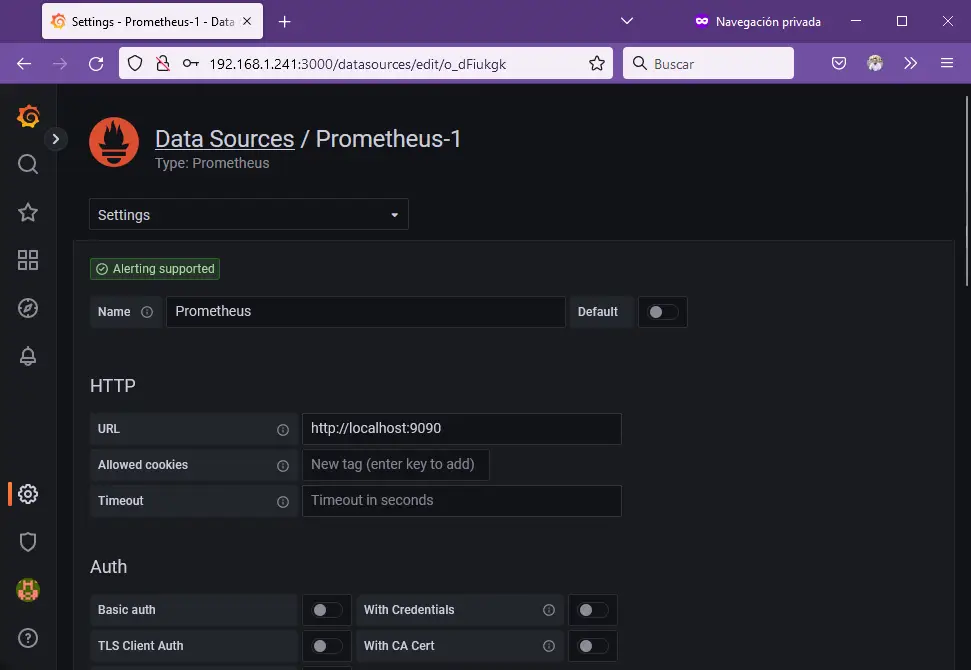
In the end you can save & test the data source to validate the correct configuration.
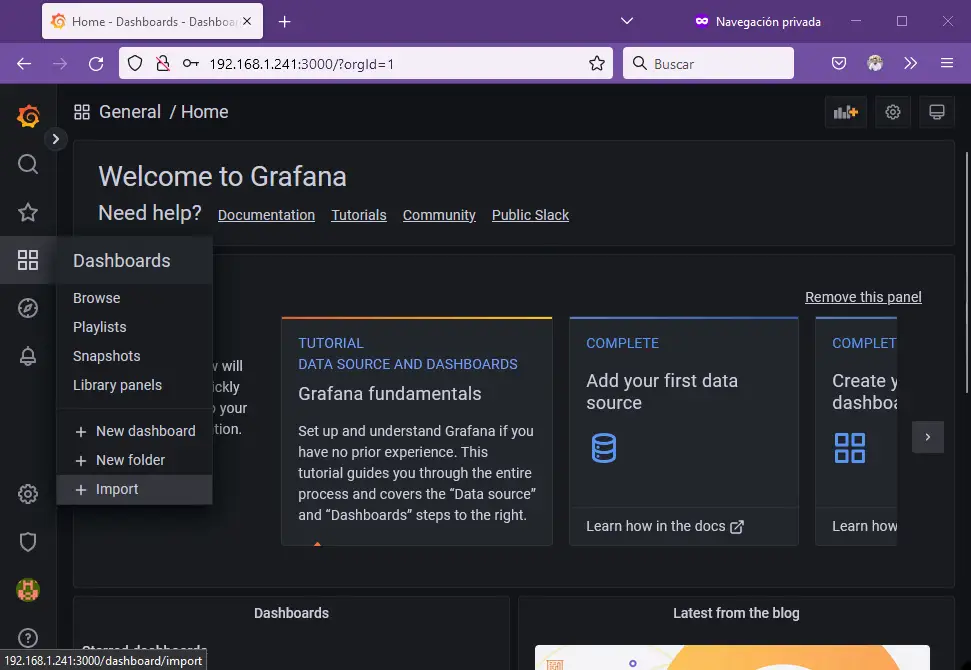
Creating the new Dashboard
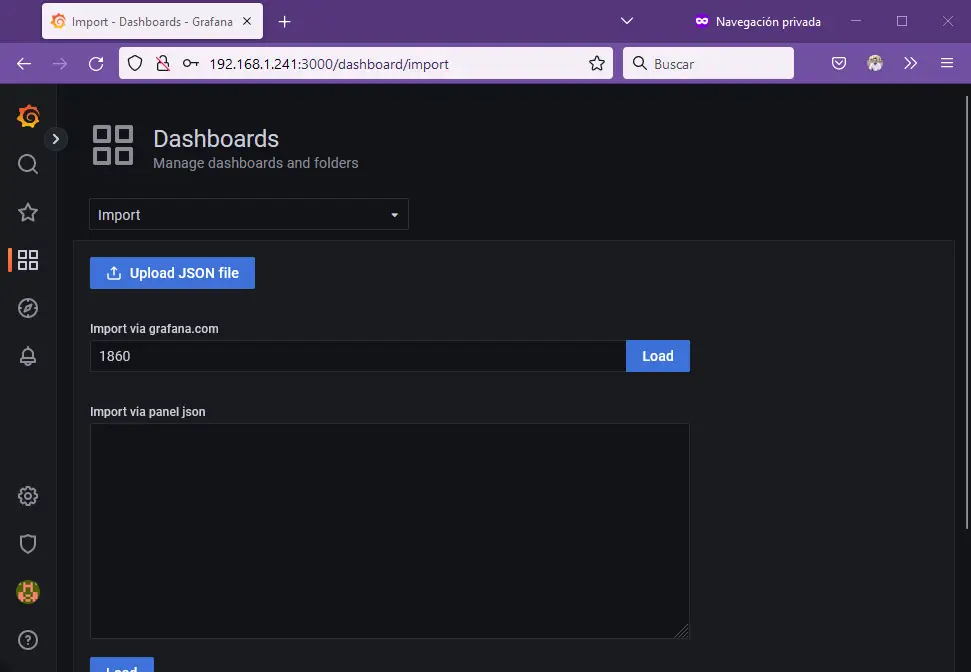
Grafana has lots of Grafana Dashboards created by different users which are shared in the Grafana Dashboard URL. I use the “Node Exporter Full” Dashboard, so I only have to add the 1860 ID in the import Dashboard tool of Grafana.
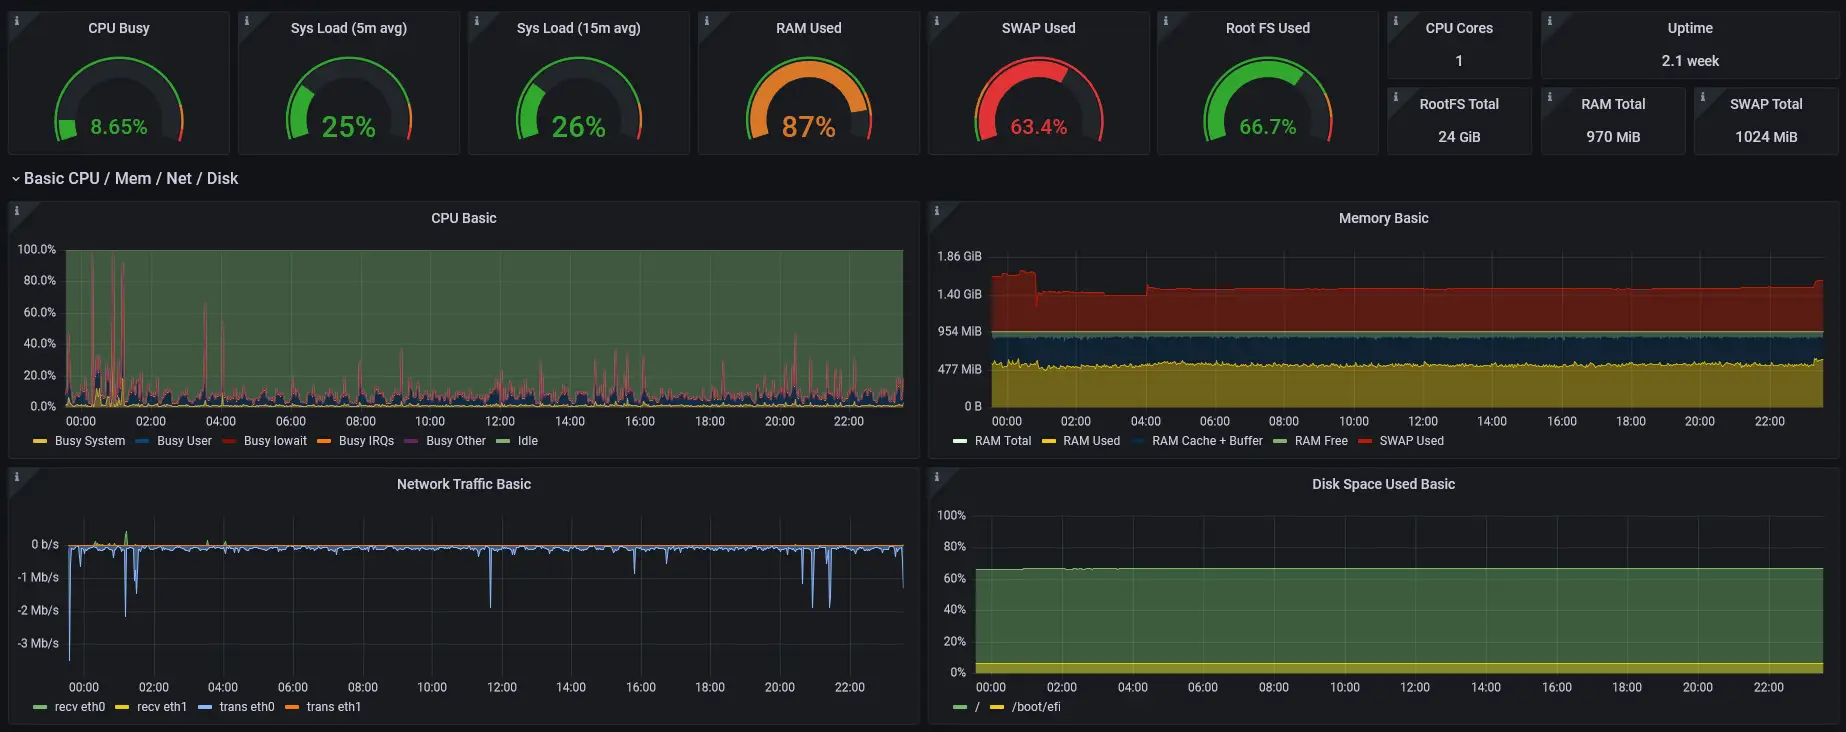
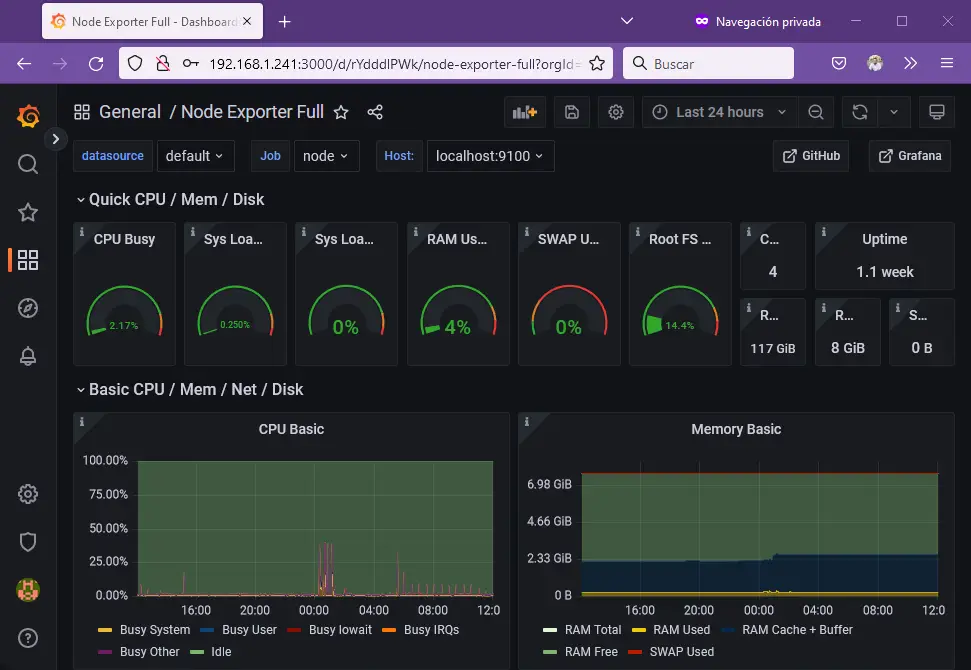
And finally, we have the Dashboard created with several statistics to monitor our server.
References:
- https://grafana.com/docs/grafana/latest/setup-grafana/installation/debian
- https://prometheus.io/docs/guides/node-exporter
- https://grafana.com/dashboards/1860 (For prometheus-node-exporter 0.18 or newer)

Hey! 👋 Thank you for visiting this page. If you enjoy my work, consider supporting with a Coffee, it really makes a difference :)